My recent conversation with historian David Kaiser addressed the racial wealth gap from the New Deal era through the decades following World War II. Even though our explicit subject was the question of whether New Deal policies were racially biased, we ended up getting into some territory that went beyond that. In fact, you could view that episode of TGS as a conversation about the nature, causes, and severity of wealth disparities between blacks and whites.
This particular aspect of the discussion piqued the interest of frequent TGS correspondent Clifton Roscoe. Clifton agrees that redlining cannot account for the present black-white gap in wealth and homeownership, but he still has a few “quibbles” with what David and I were saying. In particular, he cites a lot of data that suggests there is quite a bit more racial wealth inequality than David and I implied there is.
I think there’s a lot worth thinking about here, so with Clifton’s permission, I’m presenting his (lightly edited) email for your consideration.
I’ve started a new YouTube channel, and I invite you to subscribe to it (and click the bell button!) now so that you don't miss future offerings. This newsletter will continue to publish as usual with the same benefits for subscribers.
This post is free and available to the public. To receive early access to TGS episodes, Q&As, and other exclusive content and benefits, click below.
Dear Professor Loury,
Thanks for having David Kaiser on your show. It was helpful to hear his views on the intent behind several policies that have been labeled as racist. As is often the case, the story is more complicated than what popular narratives suggest. While I enjoyed the conversation, I've got a few quibbles with some of the “facts” that were discussed.
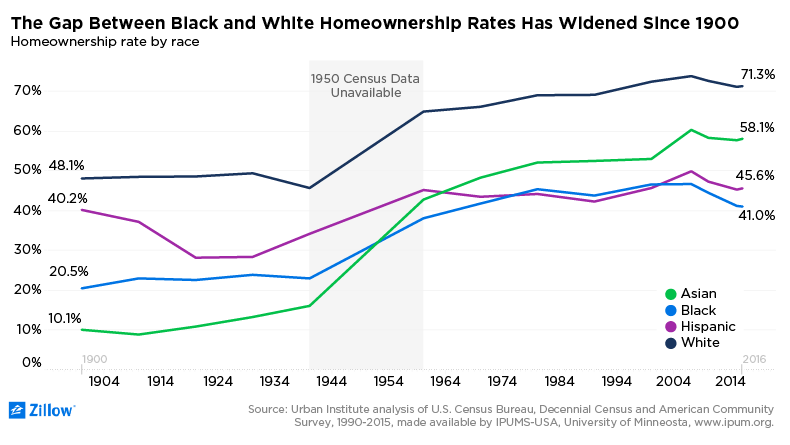
Let's start with homeownership. There has been an enduring 27-30 percentage point black-white home ownership gap since at least 1900 according to an analysis by Zillow. Here's a graphic:
The latest figures from the US Census Bureau puts the gap at 29.6 percentage points (74.2% home ownership rate for whites and 44.6% for blacks) as of Q2 of this year. Look at Table 7 if you want to do a deep dive. Draw your own conclusions, but redlining doesn't seem to be what drives the gap.
That said, I don't think your discussion of the wealth gap was as strong as it could or should have been. Among other things, the argument that the black-white wealth gap is modest below the 90th wealth percentile is inaccurate. Let's start with some basic numbers from both the US Census Bureau and the St. Louis Fed.
Census Bureau numbers from 2018 show that the racial wealth gap is prominent at both ends of the distribution. Just over 32% of black households have zero or negative net worths compared to about 13% of white households. Just over six percent of black households have net worths above $500,000 compared to about 27% of white households. Use this link, download the “Wealth and Asset Ownership” spreadsheet, and go to Table 4 if you want to do a deep dive.
Most Black and Hispanic Families Are Less Wealthy than the Typical White Family
Using SCF data, we evaluated family wealth and found:
A typical (median) white family owned about $184,000 in family wealth;
A typical Black family owned $23,000; and
A typical Hispanic family owned $38,000.
The median wealth gap between Black and white families of 12 cents per $1 of white wealth is largely unchanged over the past 30 years, while the gap between Hispanic and white families, 21 cents per $1 of white wealth, slightly improved but remained large.
Black, Hispanic and white families had more wealth at the average—$143,000, $249,000 and $962,000, respectively—than at the median. These findings are a function of the wealth distribution within each racial and ethnic group: There are few very wealthy families, but their vast amount of wealth pulls the average up. For example, the figure below shows wealth at the 75th percentile, which is lower than the average, meaning most Black, Hispanic and white families have less than the group’s average. Because of this, we choose to compare medians (values at the middle of the distribution), as we believe these are more representative of a typical family’s experience.
NOTES: This graphic shows the relative size of family wealth for different racial and ethnic groups. From left to right, the 25th percentiles, 50th percentiles or medians, and 75th percentiles are shown. Also, wealth gaps in terms of Black and Hispanic families’ cents per every dollar of white family wealth are shown for each percentile group. SOURCES: Federal Reserve Board’s Survey of Consumer Finances and authors’ calculations.
The vast majority of Black (82%) and Hispanic (76%) families had less wealth than the typical white family at the median. In fact, the entire wealth distributions of Black and Hispanic families are shifted toward lower wealth, while the distribution of white families is more evenly dispersed, as seen in the figure below.
Hispanic families have low wealth. White families were more likely to be millionaires, and Black families more likely to have negative wealth, meaning their debts were greater than their assets.
Percentages of households who are millionaires:
White families—15%
Black families—2%
Hispanic families—3%
Percentages of families who were in debt:
Black families—18%
Hispanic families—12%
White families—8%
The analysis goes on to show racial wealth gaps that persist regardless of education level, parental education level, or family structure.
I'm not an expert, but the persistence of these gaps is a function of a lot of factors. Data from the Federal Reserve shows that the savings and investment portfolios of black households are different than those of whites.
As of Q2 of this year, here's how whites and black asset ownership percentages compare:
Asset Class White % Black % Real estate 21.3 28.3 Consumer durables 4.2 6.5 Corporate equities and mutual fund shares 29.0 6.3 Pension entitlements 19.6 41.0 Private businesses 9.7 4.1 Other assets 16.3 13.9
The overall picture is one where blacks tend to have less exposure to equities and private businesses, asset classes that tend to generate higher than average returns over time. An Ariel-Charles Schwab analysis that was released in February of this year makes a similar point. Here's a graphic:
This suggests that older blacks tend to shy away from equities, an asset class that appreciates better than most over time. It's also worth noting that the Ariel-Schwab analysis showed that blacks who earned more than $100,000 per year invested less per month than their white peers. (The average is $686 for Blacks and $1,031 for whites. See page 21 for details.) The full Ariel-Schwab report is worth a read if you want to do a deep dive.
I'll spare you a full blown data dive, but I hope we can agree that the racial wealth gap is a complicated topic, and that it's a function of more than redlining and other forms of institutional bias.
Very interesting post, but I think the age issue deserves more attention. Mr. Roscoe interprets the last graph as a reflection of current reality rather than history. By this I mean that Mr. Roscoe assumes that the youngest cohort is on a trajectory to become just like their older counterparts. They have equal equity now to whites, but will lose it as they age. My own guess at what is going on is that the oldest cohort is behind whites because they started out handicapped by existing discriminatory policies. But because circumstances have improved - barriers to black progress in America have been slowly disappearing - the younger cohorts are less and less affected.
I'm surprised that I never hear scholars with a research interest in this area incorporate family structure into their analyses of "household income inequality." The unstated premise seems to be that family structures are equal across all races and income quintiles, when the data show precisely the opposite. Even in a hypothetical world where all adults were paid the same, if one race tended to have more intact households than another, this would give rise to substantial "household" income inequality that has nothing to do with discriminatory practices in the workplace.