

The Economy Is Recovering. Why All the Pessimism?
The Economy Is Recovering. Why All the Pessimism?
A guest post from Clifton Roscoe

By most objective measurements, the economy is on the upswing after four bad years. Inflation is way down, job growth is strong, and GDP has recovered from losses incurred during the worst of the pandemic. But despite this broadly positive news, many people report that they feel worse off now than they were before the pandemic. That’s bad news for Joe Biden. If he’s going to stand a chance against Trump in November, he not only needs a strong economy, he needs Americans to believe the economy is strong. He seems to have the former. Why is the latter so elusive?
As usual, our correspondent Clifton Roscoe is on the case. He’s done a deep dive on the numbers and settled on at least one plausible explanation for this economic pessimism: prices. I’ll leave it to Clifton to lay it all out for you below.
This post is free and available to the public. To get early access to episodes of The Glenn Show, as well as an ad-free podcast feed, comments, Q&As, and other exclusive content and benefits, click below.
The Lingering Effects of Inflation
by Clifton Roscoe
The last four years brought a series of economic challenges the country is still trying to overcome. The coronavirus created enormous public health and economic challenges. Over 110 million Americans have contracted the disease and almost 1.2 million Americans have succumbed to it. Lockdowns, remote learning, and a big shift to working from home, along with global supply chain disruptions, led to a sharp drop in real GDP and a spike in the unemployment rate during the first half of 2020. Washington responded with massive relief packages that mitigated these issues and reversed their effects quickly.
But the relief packages (The New York Times estimates they totaled $5 trillion) and supply chain disruptions led to an inflation spike. The Ukraine War exacerbated inflation, since Russia is a major producer of energy and Ukraine is a major producer of grains.
In response, the Fed raised interest rates in an attempt to bring down inflation without causing a recession or an unemployment spike. As of now, GDP growth is solid, jobs growth is good, and the unemployment rate is low. Inflation came in at a 3.1% annual rate in January. That’s above the Fed’s target of 2%, but it’s way down from the 9.1% annual rate that was measured in June of 2022. Moreover, the consensus among economic forecasters is that 2024 will be a decent year. The Federal Reserve Bank of Philadelphia just released a new “Survey of Professional Forecasters.” Their consensus forecast has real GDP growing at 2.4%, jobs creation of 235,800 per month, a year-end unemployment rate of 4.0%, and inflation averaging 2.5% this year. Corporate America has come around, too. The Conference Board’s “Measure of CEO Confidence” is now above 50% for the first time in two years. This suggests corporate executives are optimistic about what’s ahead for the economy, and the consensus among economists is that we're on the mend.
Main Street, however, remains pessimistic. As of January, the National Federation of Independent Business’s Small Business Optimism Index was lower than it has been at the beginning of the past five years. The University of Michigan’s Consumer Sentiment Index shows signs of improvement, but is at levels comparable to what we saw back in 1982 and 2009. Last, but not least, Gallup’s Economic Confidence Index, while improving, is firmly in negative territory.
So what gives? Why are so many Americans gloomy about the economy, despite objective signs of improvement? A columnist for Yahoo Finance suggested four theories:
Selective pain points: The idea is that people are still feeling the pain of high prices that have persisted in key items such as food, rent, and transportation.
Debbie Downers everywhere: The argument is that the overall tone of the news that people hear is negative and this has put the public in a sour mood.
Referred pain: The idea is that people are gloomy because “scourges” (e.g., mass shootings, immigration chaos, overdose deaths, overseas wars) are making us feel bad about everything.
Political fatalism: This is a partisan theory that says Republicans are overly gloomy because Democrats are in power and their collective gloominess is skewing public opinion polls.
There's some truth in all of these theories. Let's consider them in reverse order.
Political Fatalism
Here's a graph of consumer sentiment, by party, from the University of Michigan:
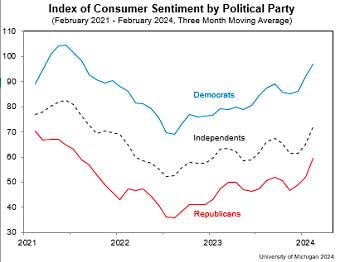
It shows stronger consumer sentiment numbers for Democrats than for Independents and Republicans, but the numbers for all three groups show a similar pattern and are below those at the beginning of 2021. The drop in consumer sentiment coincides with the inflation spike that began in 2021. Some of the differences by party may be due to partisanship, but class differences seem to be at play as well. The Republican base includes a lot of working class Americans while the Democratic base includes a lot of college graduates who are more likely to have stable employment and higher incomes than most.
Debbie Downers Everywhere and Referred Pain
The impacts of these things are hard to measure. Economists at Brookings and Moody's Analytics have taken stabs at it. Brookings’s analysis suggests that increasingly negative news might explain about a third of what they say is the overly pessimistic take on the economy shared by many Americans. Two-thirds of the gloominess is unexplained, even if you buy Brookings's analysis.
Selective Pain Points
Gallup’s analysis shows that inflation is affecting a majority of Americans. Inflation per se isn’t the problem. It’s the stickiness of prices. Inflation has cooled, but prices haven't come down. Achieving milestones of success (e.g., purchasing a home, having a nice vehicle, having an occasional nice meal away from home, etc.) has gotten much harder as well. A comparison of the growth in household income with the growth in prices explains a lot of the gloominess.
Let’s start with average weekly earnings for private sector employees in nominal dollars (i.e., not adjusted for inflation). Here are the numbers for January 2016, January 2020, and January 2024:
January 2024: $1,178.16
January 2020: $975.49
January 2016: $878.15
I took four-year cuts to even out some of the year-to-year commodity market swings that can affect prices and to even out some of the impacts of the inflation peak that took place in 2022. Here are the weekly earnings increases:
January 2020 – January 2024: 20.8%
January 2016 – January 2020: 11.1%
Let’s compare those numbers with the consumer price index (CPI), a measure that reflects the costs to consumers of a market basket of goods and services. The period 1982 - 1984 is referenced at 100.
Here are the numbers for January 2016, January 2020, and January 2024:
January 2024: 309.685
January 2020: 258.906
January 2016: 237.652
Here are the CPI increases:
January 2020 – January 2024: 19.6% (309.685 / 258,906 = 1.196 or a 19.6% increase)
January 2016 – January 2020: 8.9% (258.906 / 237.652 = 1.089 or an 8.9% increase)
Average weekly earnings grew faster than inflation in both periods, so some will conclude that most households got through both periods without much economic pain. A look at a cross section of categories, however, reveals several “pain points.”
The Bureau of Labor Statistics maintains a database of actual prices for about 70 items. They feature a cross section in an interactive tool available online. Comparing growth in prices for these items with the growth in weekly earnings illustrates how several years of high inflation have hurt many Americans. This is the growth in prices between January 2020 and January 2024 for the 11 items featured by the tool. A negative number indicates a drop in price.
Bananas: 8.2%
Navel oranges: 24.6%
White bread: 50.5%
Field tomatoes: -3.4%
Fresh, whole chicken: 41.0%
Electricity: 29.1%
Eggs: 72.6%
Unleaded regular gasoline: 25.5%
Ground chuck (100% beef): 24.3%
Utility (piped) gas: 36.2%
Whole, fresh milk: 21.7%
Prices for nine of these 11 items grew faster than average weekly earnings.
Here are the comparable price growth figures for January 2016 – January 2020:
Bananas: -1.9%
Navel oranges: 4.0%
White bread: -5.2%
Field tomatoes: -12.1%
Fresh, whole chicken: -1.4%
Electricity: No change
Eggs: -37.2%
Unleaded regular gasoline: 30.5%
Ground chuck (100% beef): 2.0%
Utility (piped) gas: 18.7%
Whole, fresh milk: -1.8%
Prices for six of the 11 fell between 2016 and 2020 and only two grew faster than weekly earnings.
This list only includes food and energy items. The pain associated with rising food prices is especially acute for lower income families. Here’s a graphic from the USDA that shows households in the lowest income quintile spend more than 30% of their after-tax income on food compared to just under 8% for households in the highest income quintile:
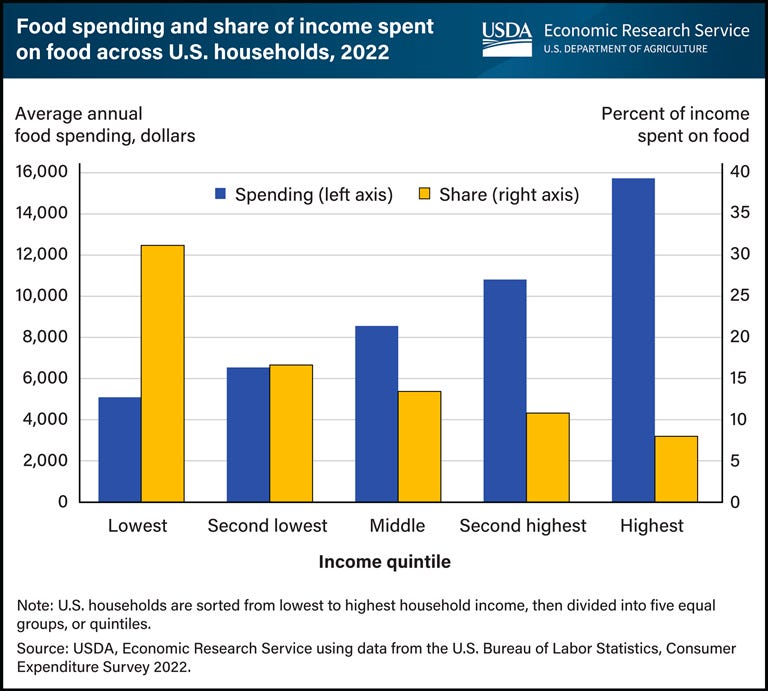
It’s probably not a stretch to think that households in the lower income quintiles spend more of their after-tax income on energy as well.
The items above are things that people purchase often, so the pain between 2020 and 2024 was constant. I also took a look at items that people purchase less frequently, but are still important: housing (home prices and rents), household item repairs, new and used vehicles, vehicle maintenance and repair, and motor vehicle insurance. Here is the change in CPI for these items between January 2020 and January 2024:
Home prices: 47.2%
Rents: 22.0%
Household item repairs: 39.2%
New and used vehicles: 26.0%
Vehicle maintenance and repair: 32.0%
Motor vehicle insurance: 38.7%
Inflation for all of these items grew faster than weekly earnings. Here are the comparable growth numbers for January 2020 – January 2024:
Home prices: 21.1%
Rents: 15.7%
Household item repairs: 22.1%
New and used vehicles: -0.5%
Vehicle maintenance and repair: 9.9%
Motor vehicle insurance: 20.9%
Inflation for four of these six items grew faster than weekly earnings.
I’ve shared a lot of numbers, so here’s a summary:
Weekly earnings grew by 20.8% between January 2020 and January 2024. Costs for 15 of the 17 items listed above grew even faster.
Weekly earnings grew by 11.1% between January 2016 and 2020. Costs for six of the 17 items listed grew even faster.
Suffice it to say that trying to stay ahead of inflation was easier between 2016 and 2020 than between 2020 and 2024.
Nobody should be surprised that a new US Census Bureau Pulse Survey showed that 31% of Americans said it was somewhat (17%) or very difficult (14%) for them to pay household expenses in the last seven days (See Household Spending Table 1 for details). Responses to a related question showed that 71% of Americans said the stress caused by price increases was moderately stressful (27%) or very stressful (44%) (See Household Spending Table 3 for details). Gallup's analysis paints a similar picture. Many people, especially working class Americans, are struggling with high prices.
Here’s an excerpt:
As has been the case in previous readings, Americans’ reports of high prices as a hardship have differed significantly based on annual household income. Those in lower-income households (76%) are more likely than those in middle-income households (64%) and higher-income households (54%) to say price increases are causing them hardship. However, income differences are even more pronounced when looking just at those saying the impact is severe. Lower-income Americans (30%) are three times as likely as high-income adults (10%) and almost twice as likely as middle-income adults (16%) to characterize high prices as a severe hardship.
Americans’ reports of the effects of high prices also differ significantly by party, with Republicans and independents describing the situation more negatively than Democrats. In all, 72% of Republicans and 64% of independents say inflation has been a hardship for them, compared with 51% of Democrats.
High prices are forcing households with children to make food substitutions they wouldn't make under normal circumstances. Here's a summary of the results from the Pulse Survey's Food Table 2, which dealt with food sufficiency within the past seven days:
42% of households said they had enough of the kinds of foods wanted
29% of households said they had enough food, but not always the kinds wanted
8% of households said sometimes there's not enough to eat
2% of households said often there's not enough to eat
19% did not report
Almost as high a percentage of families with children are making substitutions or running short of food (39%) as those who have enough of the kinds of food they want (42%). An article from the Associated Press showed that food banks are facing high demand and are having to make food substitutions in response to high prices.
These families’ struggles are consistent with a narrative that says the American Dream is fading for many people, that they won't be able to do as well or better than their parents after inflation. Raj Chetty of Harvard and others explored this topic in an important paper several years ago.
Here's a graphic that illustrates the point:
Our baseline estimates of absolute mobility assume copula stability from 1940 to 1984 and measure family income in real pretax dollars at age 30. Figure 1A plots rates of absolute mobility by parent income percentile for the decadal birth cohorts, 1940 to 1980. Each series shows the percentage of children earning more than their parents versus their parents’ income percentile, limiting the sample to parents with positive income.

Fig. 1 Baseline estimates of absolute mobility by birth cohort.
Graph B (on the right) shows the percentage of people aged 30 whose incomes, adjusted for inflation, exceeded that of their parents at the same age. The data shows that those born in 1940 had a 94% chance of earning more than their parents. The odds were down to 50% for those born in 1980. What was an almost sure thing became a coin flip in 40 years.
Graph A (on the left) shows that parental income didn't offer much protection from these trends. Those born to parents in the top 20% of the income distribution were less likely to exceed their parents inflation-adjusted incomes than their peers. The odds got progressively worse over time, with those born in 1940 to high income parents being more likely to exceed their parents inflation-adjusted incomes than those born later.
My friends and I often wonder how working class families with children keep food on their tables. We wonder how far they can stretch a pound of ground beef that costs $5.03. We wonder what meal planning is like when whole, fresh chicken is $1.99 per pound What about snacks? Are potato chips off the table now that they cost $6.39 per pound? Working class families have to make tough decisions every day. How frustrating must it be to have to decide whether you should buy a bag of chips for your kids or two more gallons of gas ($3.22 per gallon) for your car, knowing that you can't do both?
Inflation has made it harder for many families to keep food on their tables, roofs over their heads, and their vehicles running. It has also reduced the odds of achieving the American Dream for a lot of Americans. When families are forced to sacrifice even meager “luxuries” like potato chips in order to afford gas, we shouldn’t be surprised that news of a strong economy doesn’t allay their pessimism.

Jeffrey Anderson's take is also about prices- and is here presented in a concise piece in City Journal. I'm only surprised that such things need saying.
"While Krugman may characterize a 3.4 percent increase in consumer prices over the 12-month period ending this past December as “plunging inflation,” most Americans likely just noticed that prices, already quite high at the start of 2023, were even higher by year’s end."
https://city-journal.us4.list-manage.com/track/click?u=b75d222a8ff4ade269f9efd3b&id=5b140a0c7f&e=abe294da4e
In addition to what's already been said, here's a couple more ideas:
1) Cognitive bias. If I go buy 20 items, where a) none of them are cheaper, b) 10 of them are the same price, 7 are up 10%, and 1 is up 100%, guess what I remember?
2) Distrust (well-deserved, IMO) in institutions. Neither Paul Krugman or Karine Jean-Pierre is going to change my mind.